Topic category: Elections - Politics, Polling, etc.
Beyond the Daily Polls
Daily tracking polls provide interesting perspectives of the presidential race that are not readily noted by just following day-to-day changes in the daily poll numbers.
The LA Times/USC Daily Tracking Poll began reporting results on July 10. Daily poll numbers represent an average of randomly sampled polling if a control group over the prior seven days.
These data provide interesting perspectives of the presidential race not readily noted by just following changes in the daily poll numbers. Here are a few of those perspectives based on data up to and including September 20:
Hillary Clinton reached her highest polling, 46.3%, just once back on August 13.
Donald Trump met or exceeded Clinton’s peak polling 13 separate times including eight consecutive days up to and including September 20.
Trump’s lowest performance in the poll was 41.6% on July 10.
Clinton’s poll performance fell below Trump’s lowest point five times in the most recent week (prior to and including September 20).
From August 13 to September 20 Clinton’s support fell 4.1% while Trump’s support rose 4.7%, a net swing in Trumps favor of 8.8%.
These observations reveal that since August 13 there has been a steady movement in support from Clinton to Trump.
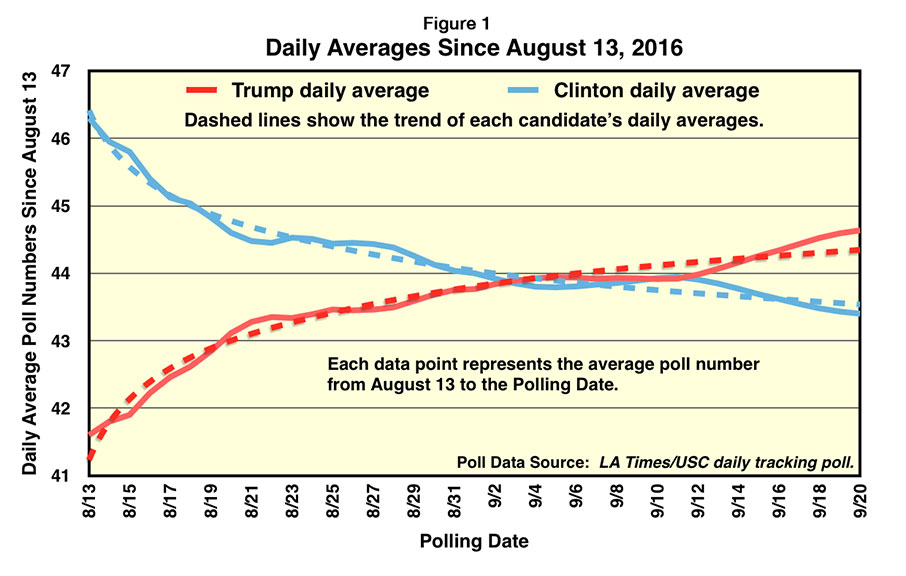
Daily Averages Since August 13
Looking at averages to date since August 13, Figure 1 shows a net swing in poll averages of 6% (from 4.7% in favor of Clinton on August 13 to 1.3% in favor of Trump on September 20).
A logarithmic trend best fits the history of daily averages and suggests the slow and steady trend in favor of Trump will likely continue.
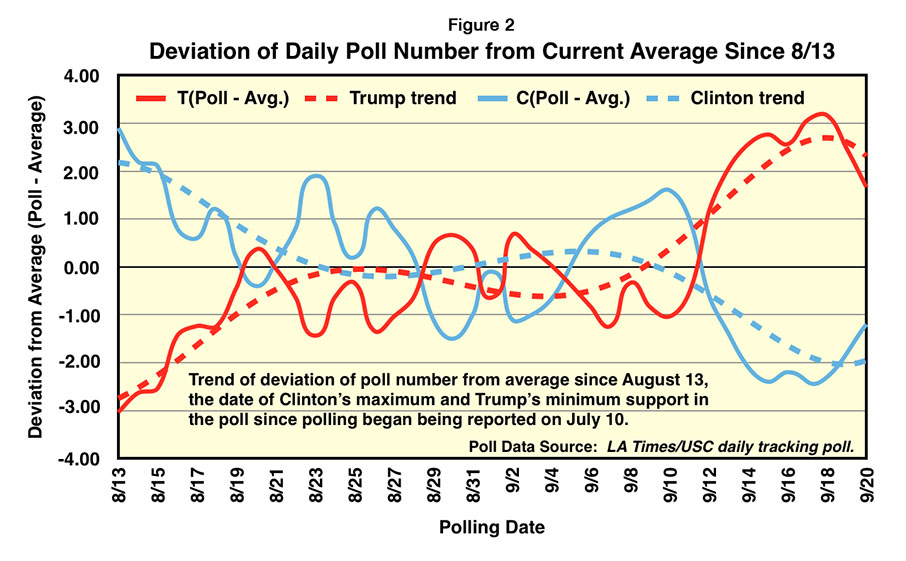
Daily Deviations from Averages to September 20
In Figure 2 below, each candidate’s September 20 average was used to chart the deviation from their respective averages of each candidate’s daily poll numbers from August 13 to September 20. These deviations show both volatility in the daily polls as well as the trend of these deviations over time.
A positive number (above the zero line) indicates the candidate’s performance is exceeding their average whereas a negative number indicates a candidate whose poll numbers are performing below their average to September 20.
A fifth order polynomial trend line is fit to each candidate’s deviations. This trend provides an indicator of the candidate’s future poll movement. A trend line above zero indicates a candidate is performing above their average whereas a trend line below zero indicates a candidate who is underperforming their average since August 13.
The trend line in figure 2 smooths the variability in the underlying daily poll data. Trump’s trend line improved as his performance in polls improved from August 13 to August 25, then dipped slightly to September 3, then began a recovery that has strongly surged from September 9 to September 17 before settling a bit over the three days prior to September 20. For most of the past three weeks, Trump has been outperforming his poll average by a considerable margin. Between August 23rd and September 9 Trump and Clinton performed about the same, trading leads several times. For most of the past two weeks, Trump has established a strong surge in popularity as reflected in the poll trends.
Clinton’s trend declined from August 13 until August 23, then remained nearly steady until September 9 when Clinton’s performance dropped sharply. Clinton’s poll numbers have rebounded over the past few days, but still remain below her average to September 20 by more than a percentage point.
Despite Trump’s surge and strong position in this poll, the past several days have shown an improvement in Clinton’s polling and a decline in Trump’s polling. Given these daily figures actually represent an average over the prior week, it is hard to find a reason to explain Clinton’s improvement and Trump’s decline.
While the LA Times/USC Daily Tracking Poll is based on a sound methodology, nevertheless, when it’s random sampling of 5500 participants averaged over a week produce results that have no apparent foundation, some doubt is cast on the veracity of the polling process.
Everything happens for a reason. The sharp upward surge of Donald Trump’s polling while Hillary Clinton was dropping rapidly was in response to Clinton’s multiple damaging actions (her “deplorables” statement, her stumble and recurring health issues, her continuing lack of forthrightness about her health) together with Trump’s outreach to Americans of African descent and the Hispanic community.
Trump continued to campaign while Clinton remained out of public sight for the better part of two days. During that time, Clinton’s supporters in print media, radio and TV “news” media went to work on Trump with their gaggle of name-calling and utterly absurd accusations, calling Trump a “racist” and every other name that came to mind. This over-the-top name-calling will ultimately boost Trump because it is baseless and so greatly detached from reality that the truth will serve to lower public perception of Clinton and her media supporters.
As Clinton and Trump square off in the first debate, the public will see Trump through their own eyes and ears without any distortion from the filter of a highly dishonest narrative spun by Clinton’s media supporters.
This coming debate will make or break each candidate. It is highly unlikelty that both will emerge unscathed with little impact on daily polling for each candidate. At that time, the daily tracking poll will have to comport with the realities of each candidate that were on display during the debate.
Meanwhile, the polls continue to paint a bright picture for Donald Trump and provide cause for serious concern in the Hillary Clinton camp.
Author of "Looking Out the Window", an evidence-based examination of the "climate change" issue, Bob Webster, is a 12th-generation descendent of both the Darte family (Connecticut, 1630s) and the Webster family (Massachusetts, 1630s). He is a descendant of Daniel Webster's father, Revolutionary War patriot Ebenezer Webster, who served with General Washington. Bob has always had a strong interest in early American history, our Constitution, U.S. politics, and law. Politically he is a constitutional republican with objectivist and libertarian roots. He has faith in the ultimate triumph of truth and reason over deception and emotion. He is a strong believer in our Constitution as written and views the abandonment of constitutional restraint by the regressive Progressive movement as a great danger to our Republic. His favorite novel is Atlas Shrugged by Ayn Rand and believes it should be required reading for all high school students so they can appreciate the cost of tolerating the growth of unconstitutional crushingly powerful central government. He strongly believes, as our Constitution enshrines, that the interests of the individual should be held superior to the interests of the state.
A lifelong interest in meteorology and climatology spurred his strong interest in science. Bob earned his degree in Mathematics at Virginia Tech, graduating in 1964.